
Business Intelligence: From Data to Decisions
What is business intelligence? Compare ready-made BI tools, a data warehouse hybrid and custom dashboards, with features, three-year cost and a phased rollout.
 By Aditya S November 12, 2026 Updated November 19, 2026 14 min read
Business intelligence (BI) is the practice of turning the data your company already records into numbers people trust enough to act on. If your Monday meeting starts with two managers arguing over whose revenue figure is right, business intelligence is the fix you are looking for.
I’m Aditya S, Business Development Manager at Synetica, a tech-based business consultancy combining strategy and execution for Dreamers and Growing Businesses. This guide uses a fictional 10-outlet retailer so you can check every number. The figures are teaching assumptions, not Synetica client results, vendor prices or industry benchmarks.
You’ll learn what business intelligence is, how it differs from a spreadsheet report, how ready-made tools, a hybrid and custom dashboards compare, which features matter, how to check a vendor, what it costs and how to roll it out in phases.
TL;DR — the whole guide in five lines
- Business intelligence is a pipeline, not a chart: collecting, storing and defining the data is most of the work; the dashboard is the last step.
- Agree on definitions first: if finance and sales count “revenue” differently, a new tool only shows the disagreement faster.
- Buy the charts: ready-made BI tools draw dashboards better and cheaper than anything you would build.
- Pay for a data warehouse only to get one trusted number: in our example the hybrid costs IDR 210 million more than ready-made at any team size.
- Build custom dashboards for many viewers or for customers: in our example custom beats the hybrid above about 49 users.

What is business intelligence?
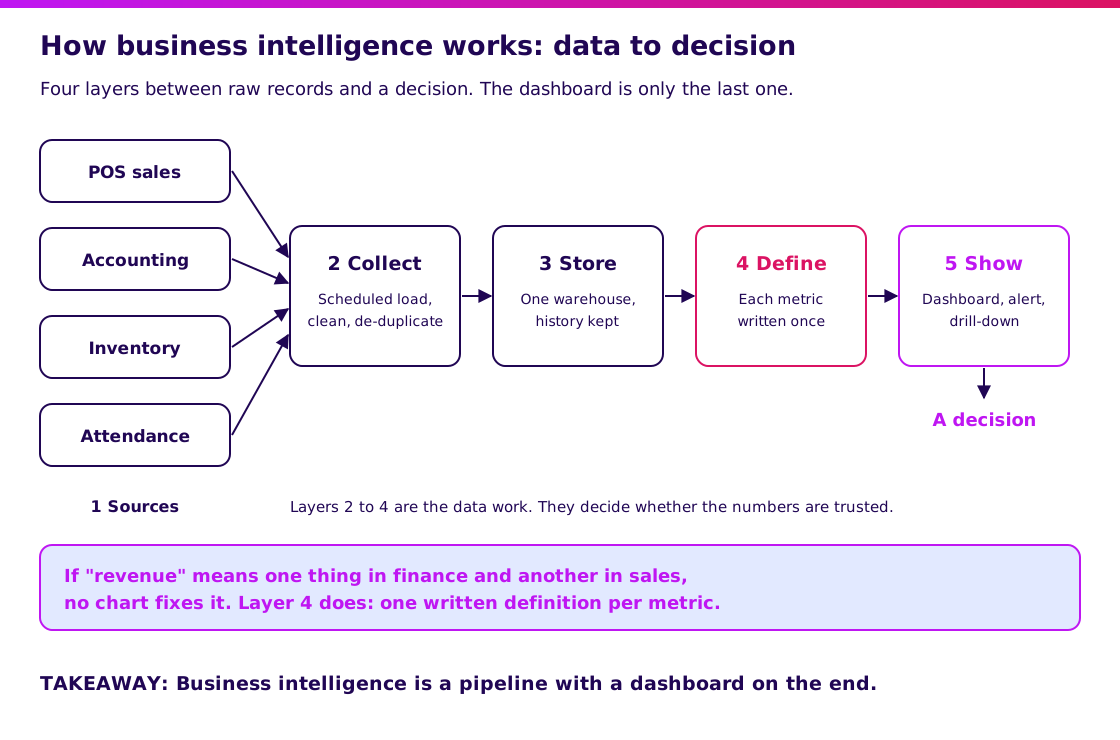
Business intelligence is the set of tools and habits that collect data from your systems, store it in one place, define each metric once and show the result as dashboards and reports. Think of the instrument panel in a cockpit: the pilot does not read the engine directly, but trusts the dial because someone calibrated it.
Gartner describes analytics and business intelligence as an umbrella term for the applications, infrastructure, tools and best practices that give people access to information so they can improve decisions and performance. See Gartner’s glossary entry.
Its core functions are:
- Collect data from sales, accounting, inventory and other systems on a schedule.
- Store it in one place with history, so last year’s numbers do not change when someone edits a file.
- Define each metric once, such as revenue, margin or stock days, so every report uses the same sum.
- Show the result as dashboards, scheduled reports and alerts.
- Drill down from a total to the branch, product or transaction behind it.
The pieces most people call “BI”, the charts, are the last layer. The first three layers decide whether anyone believes them.
Business intelligence vs spreadsheet reports vs data analytics
A spreadsheet report answers one question once; business intelligence answers the same questions every day without anyone rebuilding the file. Data analytics goes one step further and asks new questions.
| Spreadsheet report | Business intelligence | Data analytics | |
|---|---|---|---|
| Main question | “What happened last month?” | “What is happening now, and where?” | “Why did it happen, and what next?” |
| Who builds it | One analyst, by hand | Set up once, refreshed automatically | An analyst or data scientist, per question |
| Freshness | Days old | Daily or hourly | Depends on the study |
| Typical output | A file sent by email | Dashboards, alerts, scheduled reports | A finding, a forecast or a model |
| Breaks when | The analyst is on leave | A source system changes | The data underneath is unreliable |
A management information system records the operation. Business intelligence reads across several of those systems to show the whole picture.
How much time does business intelligence save? A worked example
The first payback of business intelligence is fresher numbers that people stop arguing about, not analyst hours. Still, the hours are the part you can measure. Here is a fictional 10-outlet retailer whose analyst prepares one weekly management report.
| Weekly task | Spreadsheet report | With business intelligence |
|---|---|---|
| Export data from POS, accounting and inventory | 90 minutes | 0 minutes (scheduled load) |
| Clean and merge the files | 180 minutes | 20 minutes (check data-quality alerts) |
| Build charts and slides | 90 minutes | 0 minutes (dashboard is always on) |
| Answer follow-up questions | 120 minutes | 40 minutes (managers drill down themselves) |
| Maintain dashboards and definitions | 0 minutes | 30 minutes |
| Total per week | 480 minutes | 90 minutes |
That is 8 hours against 1.5 hours. About 6.5 hours saved a week, or 338 hours a year. Time your own last four reports and replace these numbers before you trust them.
The bigger change is timing. In this example the spreadsheet report reaches managers on Wednesday, after the analyst has finished it. The dashboard is ready on Monday morning, so a branch with falling sales gets attention two days earlier. We do not put a rupiah value on that, because it depends on what your managers do with the extra two days.
Business intelligence: ready-made vs hybrid vs custom
Ready-made BI tools are cheapest and fastest; a hybrid adds a data warehouse so numbers agree; custom dashboards cost most and pay off only when many people, or your customers, need to see them. Ready-made examples include Microsoft Power BI, Tableau, Looker Studio and Metabase.
Here is how the three compare for our fictional retailer with 25 dashboard users and four data sources: POS, accounting, inventory and attendance.
| Ready-made BI tool | Hybrid (BI tool + data warehouse) | Custom dashboards | |
|---|---|---|---|
| Upfront cost | IDR 40m to connect four sources | IDR 160m warehouse and pipelines | IDR 420m warehouse and dashboard app |
| Running cost | IDR 200,000 per user per month | Same licences + IDR 30m a year upkeep | IDR 60m a year, no per-user fee |
| Time to start | 2 to 4 weeks | 6 to 10 weeks | 12 to 16 weeks |
| Flexibility | Medium: any chart, limited data logic | High for data, medium for display | High |
| Best for | Few sources, agreed definitions | Many sources, numbers that disagree | Many viewers, customer-facing dashboards |
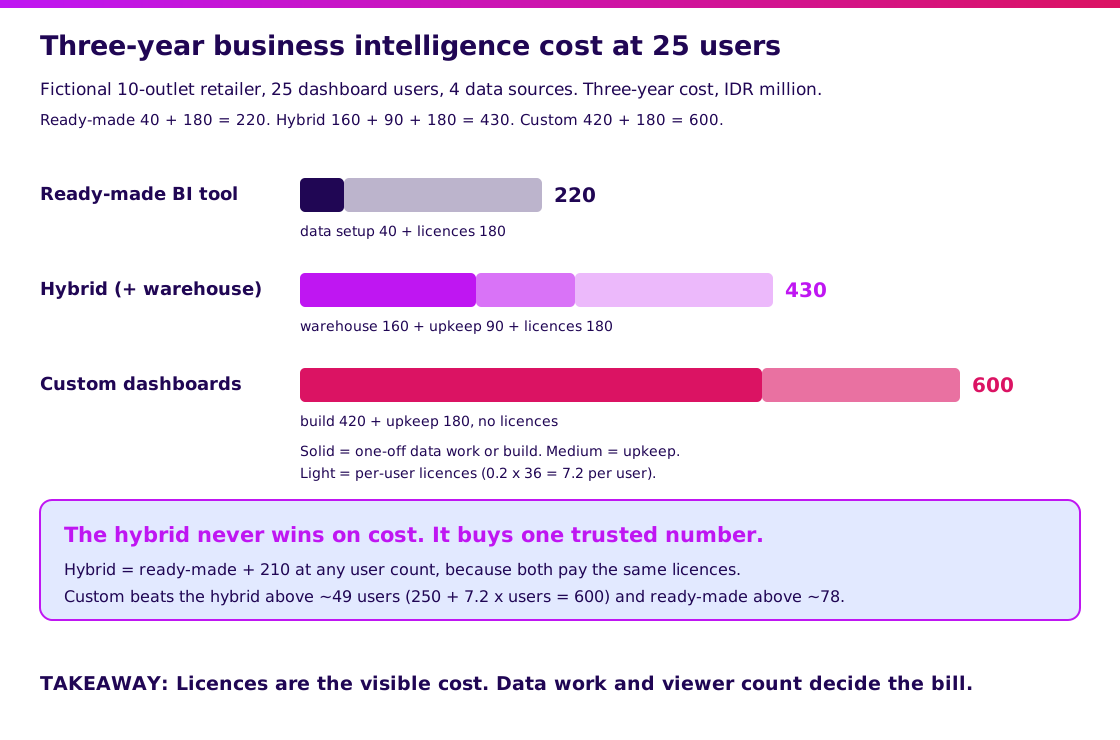
Three-year cost at 25 users: ready-made is 40 + 25 × 0.2 × 36 = IDR 220 million. Hybrid is 160 + 3 × 30 + 180 = IDR 430 million. Custom is 420 + 3 × 60 = IDR 600 million.
What do the business intelligence cost numbers show?
Two things stand out. First, the hybrid never wins on cost. It pays the same licences as ready-made plus IDR 250 million for the warehouse, against IDR 40 million of direct connections, so it is IDR 210 million more at any team size. You buy it for one trusted number, not for savings.
Second, viewers flip the sum. Each user adds 0.2 × 36 = IDR 7.2 million over three years. The hybrid becomes more expensive than custom when 250 + 7.2 × users passes 600, at about 49 users. Ready-made only becomes more expensive than custom at about 78 users. Real quotes include viewer-only tiers and discounts, so use the method, not the numbers.
Which business intelligence features are essential?
Pick features by the decision you want to make faster, not by the number of chart types. These six cover most Growing Businesses:
- Refresh on a schedule: load data from each source automatically, so nobody exports files on Sunday night. See how APIs connect systems.
- Define each metric once: keep one written formula for revenue, margin and stock days that every dashboard reuses.
- Drill down to the transaction: move from the company total to the branch, the product and the single sale behind a number.
- Limit access by role: let a branch manager see only that branch, and keep salary data away from everyone who does not need it.
- Alert on thresholds: send a message when stock days, margin or overdue invoices cross a line, instead of waiting for someone to look.
- Export everything: get the data and the metric definitions out in a standard format, so you can change tools later.
Forecasting, AI summaries and natural-language questions are nice to have. They are only as good as the data underneath, so add them after the six above work. Read why the database underneath matters.
What are examples of business intelligence in a company?
A good business intelligence dashboard is tied to one decision, one owner and one meeting. Four common examples:
| Area | What the dashboard shows | Who checks it, and when |
|---|---|---|
| Sales | Revenue and margin by branch and product against target | Sales head, every Monday |
| Inventory | Stock days and slow-moving items by warehouse | Purchasing, before each purchase order |
| Finance | Cash position, overdue receivables, spending against budget | Finance lead, at month close |
| People | Attendance, overtime and turnover by location | HR, each month |
If a dashboard has no owner and no meeting, it will be opened twice and forgotten.
When is an off-the-shelf business intelligence tool enough, and when do you need custom?
Off-the-shelf is enough when you have a few data sources, agreed definitions and a small group of viewers. Build only the part a licence cannot give you. Run these five questions in order and stop at the first one that decides it.
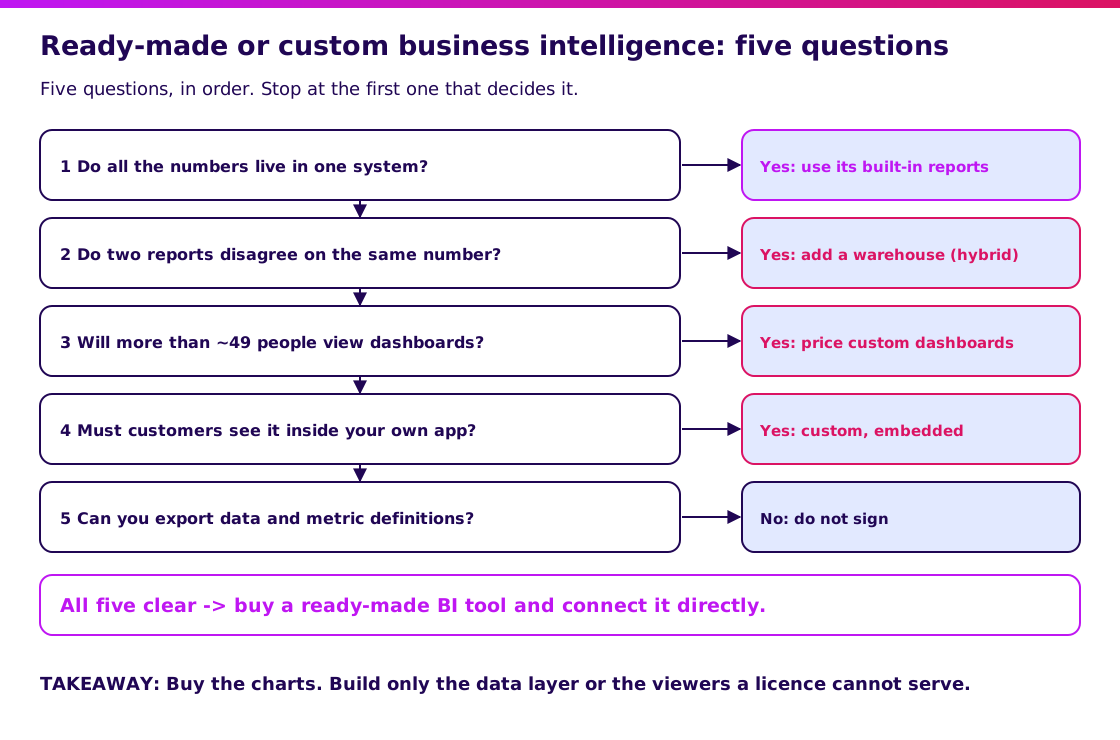
- Do all the numbers live in one system? Then use that system’s built-in reports. You do not need a separate tool yet. Read what an ERP already reports.
- Do two reports disagree on the same number? Then the problem is the data layer. Add a warehouse with one definition per metric, and keep a ready-made tool on top.
- Will more than about 49 people view dashboards? On our assumptions, per-user licences then cost more than custom dashboards. Redo the sum with your own quotes.
- Must customers see the numbers inside your own app? Dashboards for customers, with your branding and their own data only, are usually custom work.
- Can you export the data and the metric definitions? If not, do not sign, whatever you choose.
What is the honest answer for most companies?
Honest answer: most companies with fewer than 50 dashboard users should buy a ready-made BI tool and spend their effort on clean data and agreed definitions. We would not build charts for them that a licence already draws well. See the full reasoning in our build vs buy guide.
Validate it in 2 weeks. Before you spend heavily on business intelligence, Blueprint & Prototype tests your assumptions: a spec, a clickable dashboard prototype in front of the managers who will use it, and a real cost estimate. The two-week promise covers prototype validation; it does not guarantee a production launch.
At Synetica, Blueprint & Prototype takes 2 weeks, Production Grade Software takes 8 weeks, and Launch & Grow runs as an ongoing monthly retainer. If the answer is a warehouse or custom dashboards, the 8-week build starts from the validated scope.
How do you choose business intelligence software? A vendor checklist
Choose with your own data and your own questions, not with the vendor’s sample dashboard. Use this checklist before you sign:
- Connect two of your real sources in the trial and rebuild one report you already produce.
- Compare the result with last month’s official figure. If they differ, find out why before going further.
- Ask one manager who does not use spreadsheets to answer a follow-up question alone.
- Check that access can be limited by branch or department without custom code.
- Ask how often data refreshes, and what happens when a refresh fails.
- Ask where data is stored and how you get all of it back, including metric definitions, if you leave.
- Check the price at your viewer count in year two and year three, including view-only seats.
- Ask who answers support, in which language and how fast.
- Ask for two customers of your size and call them.
- Agree who owns data cleaning, metric definitions and training for new managers.
Use our vendor due diligence guide for the questions behind each point.
How much does business intelligence cost in Indonesia?
Business intelligence cost is driven by how many sources you connect, how messy they are and how many people need to view the result. In our fictional example, the three-year totals run from IDR 220 million to IDR 600 million at 25 users.
| Price driver | What to check | Why it moves the cost |
|---|---|---|
| Data sources | How many systems, and whether each can export or has an API | Each source adds connection work and upkeep |
| Data quality | Duplicate products, missing branch codes, manual journals | Cleaning usually takes longer than building charts |
| Viewers | Whether view-only users pay a full licence | The main driver of ready-made pricing |
| Refresh speed | Daily, hourly or near real time | Faster refresh needs more infrastructure |
| Customer-facing use | Whether people outside the company log in | Pushes you from ready-made towards custom |
Budget for data cleaning separately. A dashboard built on duplicate product codes will show the wrong answer with great confidence.
How do you implement business intelligence without failing?
Start with one decision and five metrics, prove the numbers match, then expand. Big-bang launches fail because 40 dashboards arrive on the same day and nobody trusts any of them.
- Weeks 1-2: scope. Pick one decision, such as weekly branch performance. Write the definition of each of its five metrics and get finance and sales to sign it.
- Weeks 3-4: connect. Load two sources and build one dashboard for that decision.
- Weeks 5-6: reconcile. Run the dashboard beside the old report. Explain every difference until the two agree.
- Week 7 onward: expand. Retire the old report, then add one decision at a time.
Name one owner for metric definitions. Without one, each department builds its own version of revenue and the Monday argument comes back. If your sales data starts at the till, our POS guide shows what a clean source looks like.
What would I tell a founder choosing business intelligence?
Start from the one decision you make too late, then build the smallest pipeline that makes it on time. If the problem is “we see last month’s margin on the 15th”, one dashboard on two sources will do.
- Few sources, fewer than 50 viewers: buy a ready-made BI tool and spend the effort on definitions and clean data.
- Many sources and numbers that disagree: add a data warehouse, and keep the ready-made tool for the charts.
- Many viewers or customer-facing dashboards: validate the dashboard with a prototype before building. Our MVP guide shows how.
My next step would be to book a scoping conversation with your list of data sources, the five numbers you check most and the tools you are considering.
FAQ — Business intelligence
What is business intelligence?
It is the practice of collecting data from your systems, storing it in one place, defining each metric once and showing the result as dashboards and reports, so people can make decisions from numbers they trust.
What is the best business intelligence tool?
There is no single best one. The best tool connects to your sources, fits your viewer count over three years, limits access by role and lets you export your data and metric definitions.
How much does business intelligence cost?
It depends on data sources, data quality and viewers. In our fictional 25-user example, three-year cost ranges from IDR 220 million for a ready-made tool to IDR 600 million for custom dashboards, with a warehouse hybrid at IDR 430 million.
Can business intelligence be custom built?
Yes. Custom fits companies with many viewers or dashboards shown to customers inside their own app. A hybrid builds only the data warehouse and keeps a ready-made tool for the charts.
Which is better, custom business intelligence or a ready-made app?
A ready-made app is better for companies with a few data sources and fewer than about 50 viewers. A hybrid is better when numbers disagree across systems, and custom is better when many people or customers need access.
Related Posts
Aditya S
Business Development Manager, Synetica.
Put it into practice
Need help putting this into practice?
We turn the ideas in this article into a prototype tested with real users in 2 weeks (from Rp49jt)—or production-grade software in 8 weeks (from Rp100jt).